Adding External Data to the Chart

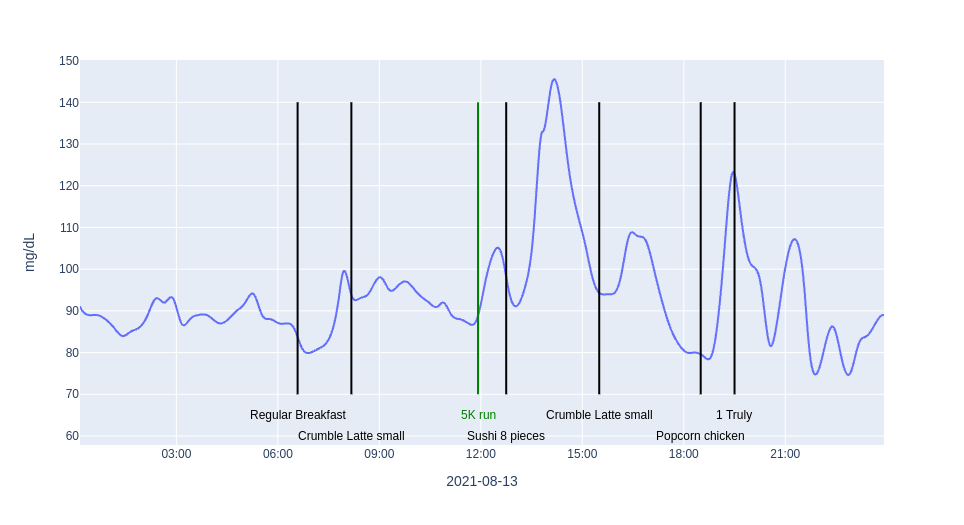
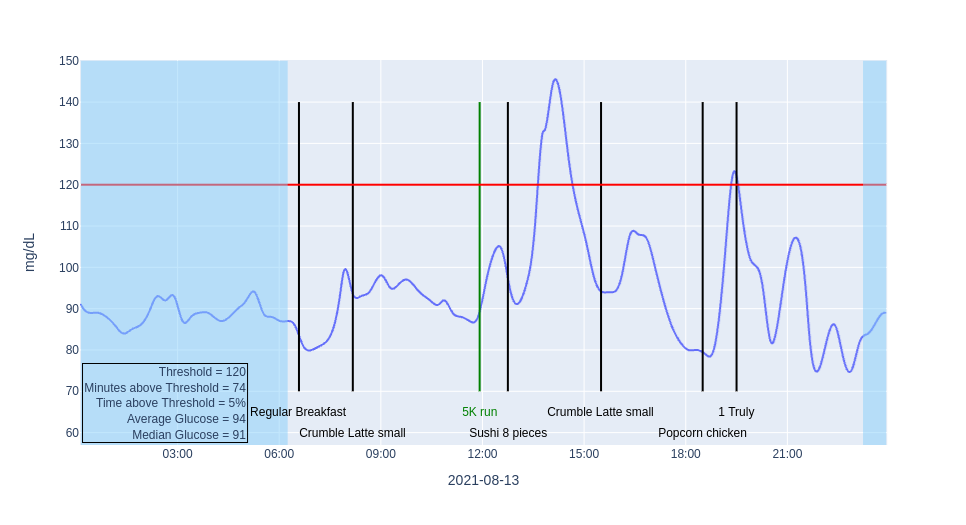
In an earlier post I had shown how to add meal and exercise data to the glucose chart. This data was coming from the same data export, meaning that the data was tracked within the NutriSense app and than exported together with the glucose data. However, what about adding data to the chart that is not part of the …

Let's Put It All Together and Chart Everything for One Day

After exploring in previous notebooks how to make a nice chart , how to add meals and exercise to the chart and finally how to calculate basic metrics , lets put it all together and make a nice overview chart for one day. The chart below shows glucose data for one day and simple glucose metrics in a small text box in …

Data Export and Manual Calibration (Update!)

(Please see an update here . Below is the original text.) After changing my sensor a couple of days ago, I noticed that my glucose was way off, compared to the readings with the prior sensor. After two days of watching the high glucose values and getting great advice from one of the NutriSense registered dietitians, I …

Calculating Basic Metrics

In addition to making charts, it is also possible to calculate metrics using the same Pandas dataframes that I used before. This notebook calculates the average and median glucose value for every day in the exported data. It does also calculates the minimum and maximum glucose value. The two images below show sample …

Adding Meal and Exercise Events to the Chart

One nice feature of the chart on the NutriSense Dashboard - Activity page is that events like meals and exercise are shown right in the chart. This presents the glucose data in relation to events that will likely influence glucose levels. As I had mentioned in a previous post , the NutriSense data export contains all …