The first thing that I want to do when I explore a new dataset is chart it. Because I am familiar with Jupyter Notebooks , Pandas and Plotly , that is the technology that I picked to make the first chart. In order to execute the notebook that I am sharing below, you only need to be familiar with Jupyter Notebooks and only to the extend that you need to be able to launch Jupyter, open the notebook and run the cells. A good guide for first time Jupyter users can be found here . If you don’t want to or cannot install Jupyter on your computer, Google Colab is another way to execute the notebook.
The first chart that I made looked as follows:
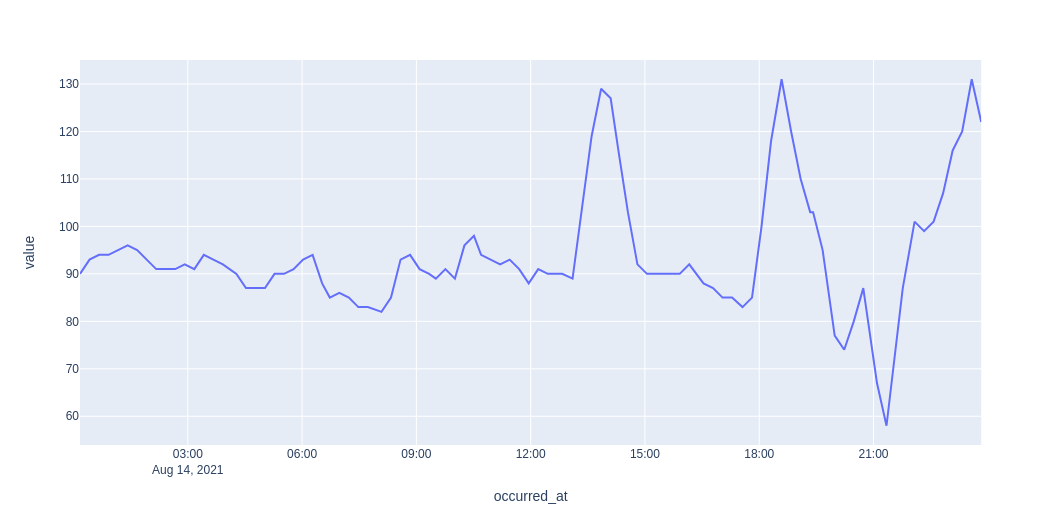
The chart is “similar” to what the NutriSense app shows on the Dashboard - Activity page, but a lot simpler and less refined. The chart plots glucose measurements over time. Creating a chart from the data export is pretty simple, it is really only a couple of lines of python code. The full notebook is available from my Github repository , and here is a direct download link . When executing it, put your exported NutriSense data into the same directory as the notebook and name the file export.csv. The full code of the notebook looks as follows: